EchoNarrator: Generating natural text explanations for ejection fraction predictions
Introduction
Many methods have achieved success in predicting ejection fraction (EF) of the left ventricle (LV) from echocardiography acquisitions. However, most methods do not offer an explanation for the prediction.
Authors argue that clear and intuitive explanations for predictions would increase trust of cardiologists in the models.
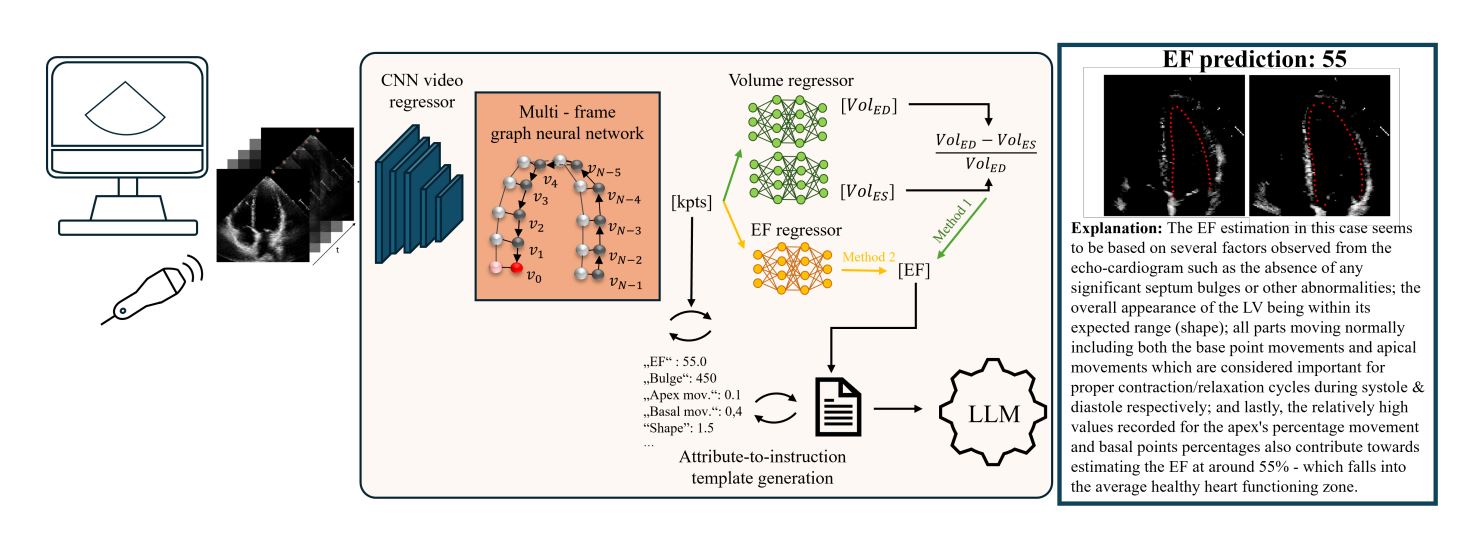
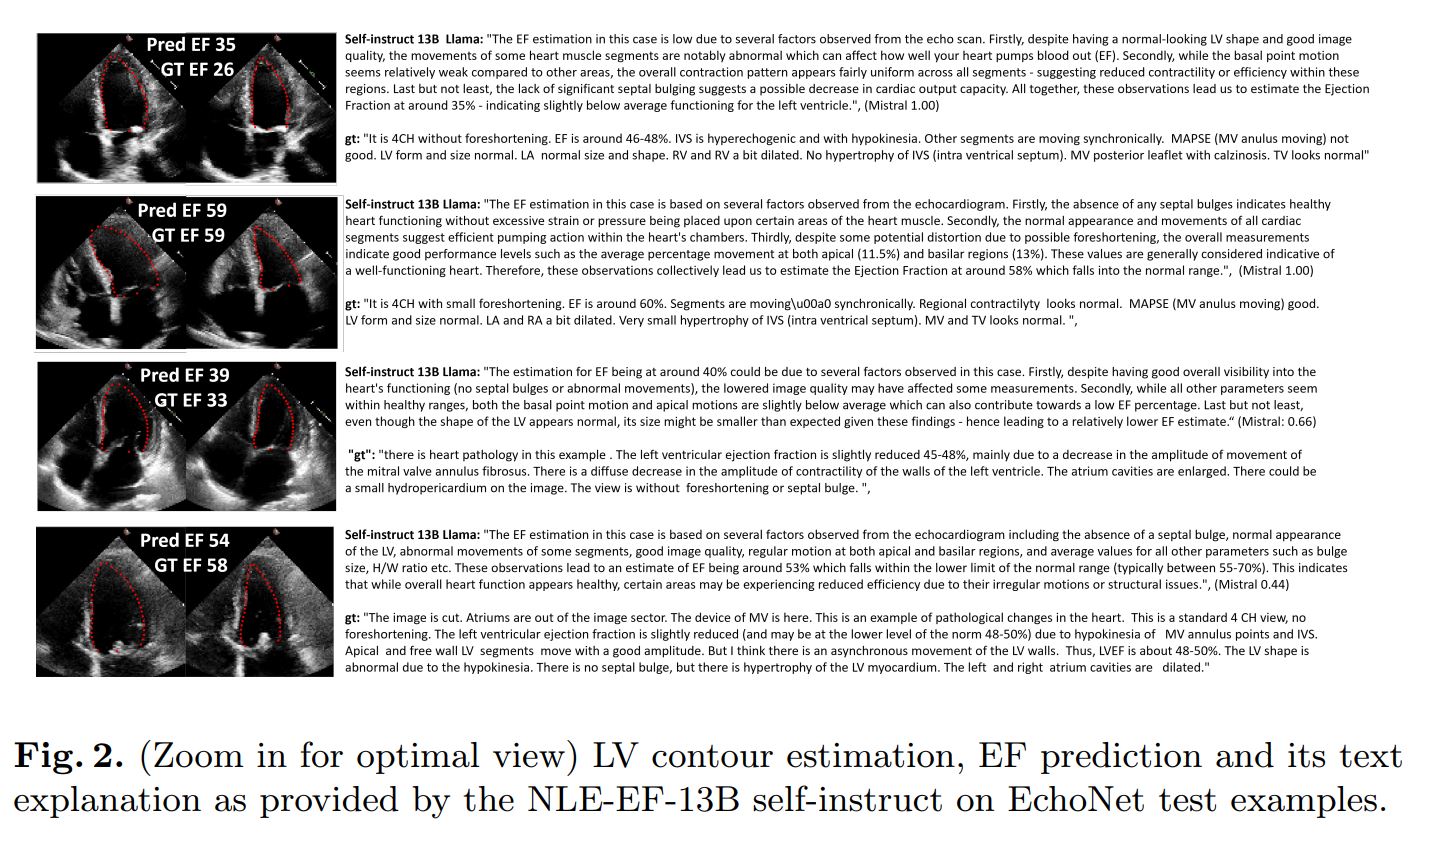
This paper proposes a novel method for EF prediction with Natural Language Explanation (NLE). In addition to providing a value for EF, it generates short form report (or a caption) explaining reasons for the value of the prediction.
NLE aims to provide context and clarity to predictions. Other explainability methods such as Class Activation Mapping (CAM) or Grad-CAM only highlight regions, and cannot offer reasoning for prediction values.
A new evaluation metric based on small LLMs is also predicted.
Method

The pipeline of this method is comprised of four main steps:
-
Predict key points forming the LV contour using a Graph Convolutional Network (GCN).
- Compute EF using two regressors, one based on the mathematical concept of contour area variation, another based on direct prediction stemming from the input encoder.
- A second regressor relying on the differences between ES/ED contours is added to mimic manual computation and to add interpretability to the EF value.
- Extract attributes from the predicted contours. These attributes are designed to reflect structural or temporal changes that could affect EF values.
- Attributes include:
- Septal bulge: calculate wall thickness variation with convex-hulls.
- Segment motion: contour is divided into 7 segments, their movement is compared to the general movement of the whole contour.
- Apex movement: apex movement should be limited, the apex generally does not move
- Length-width movement: length-width ratio of the contour, identifies dialated LV if it isn’t close to 2.
- Sector intersection: LV contour visibility within ultrasound sector.
- Image quality: intensity difference between LV cavity and myocardial wall.
- Attributes include:
- Based on a textual conversion of the attribute, output a coherent NLE aimed at clinical use.
- Basic sentences are formed as such:
bulge=500becomesA bulge value of 500 means that there is no bulge. - The basic sentences are refined into more coherent and full sentences using a LLaMA model, fine-tuned for medical text.
- Basic sentences are formed as such:
New metric
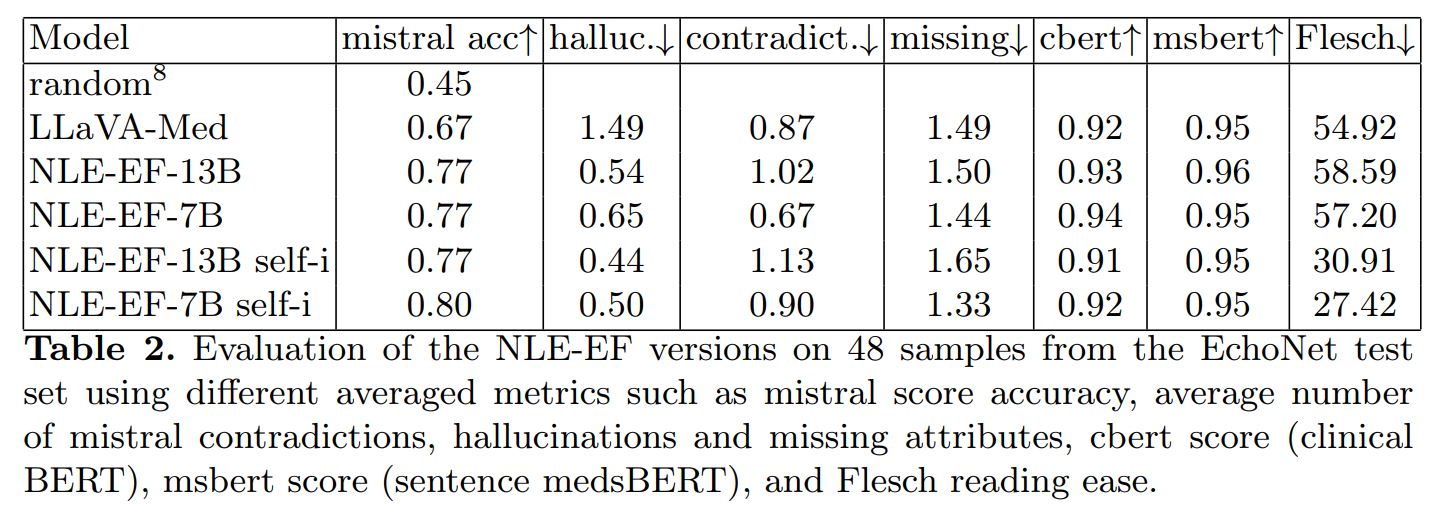
A novel metric is also presented, to evaluate EF explanations and complement basic metrics, which can be deceived by some adversarial examples. It’s aim is to allow assessment of factual correctness.
It is based on a Mistral model (small and fast LLM) that uses nine target prompts, instructions and one-shot context to evaluate the contents of the output predictions. It evaluates whether attributes are considered normal or pathological in the outputs.
It allows for comparison between ground truth and prediction beyond textual similarity. Accuracy, contradictions and hallucinations are reported.
Training
GCN
The GCN has a ResNet3D-18 backbone. It extracts feature representations from the video, which are fed to a spatio-temporal GCN that identifies anatomical keypoints.
LLM
LLMs are fine-tuned to align generated text with clinical terminology and reasoning.
Fine-tuning was done based on a low-rank adaptation of LLaMA models using 8-bit quantization.
Since the annotations are limited, the authors employ two data augmentation strategies to increase the amount of data:
- Synthetic explanations are created by making more elaborate sentences from basic sentence examples.
- GPT4 is prompted with expert explanations and a chain-of-thought prompt including basic inputs (from metrics) and examples of desired outputs to create new sets of explanations for basic texts.
Data
The data used for the experiments is mainly from the EchoNet-Dynamic dataset 1, containing 10 030 echocardiography videos.
In addition to the videos and contour information, experts watched a subset of videos and provided text descriptions, including EF assesment and explanations. In total they provided 137 image-text pairs (89-48 train-test split).
Results

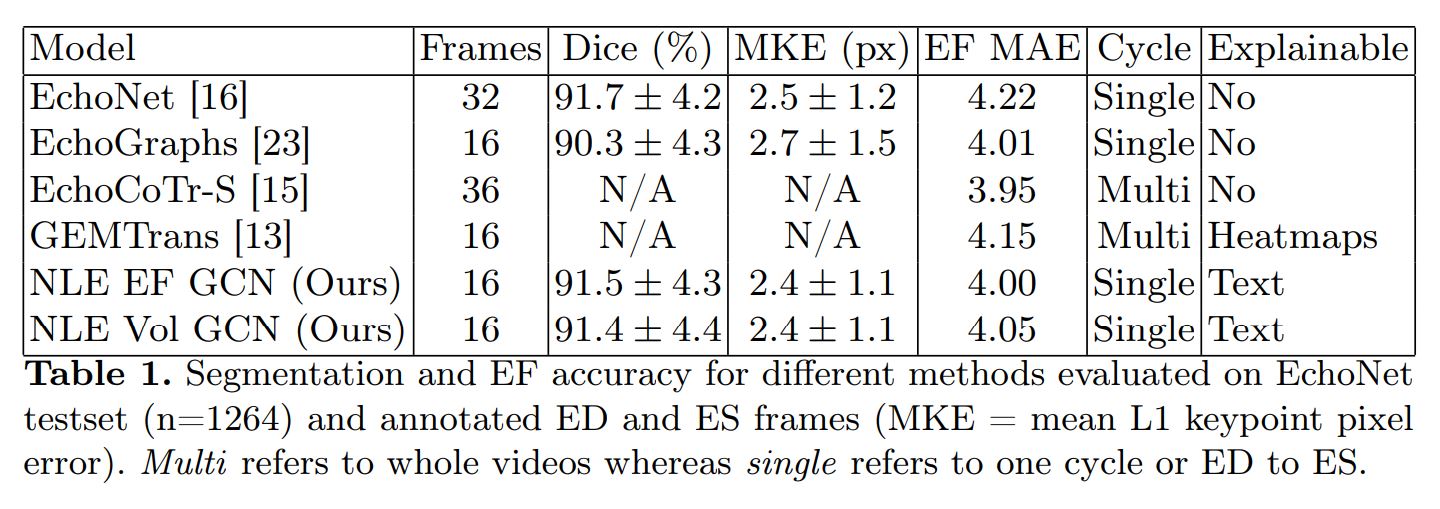
The authors evaluated their method on two fronts: EF prediction performance and NLE. For NLE, they use the new custom metric, text similarity metrics (ClinicalBERT, sBERT) and Flesh Reading Ease.


Conclusions
- Adding LLMs to EF predictions allows for more interpretability, especially in a clinical use case.
- Architecture choices such as separations between modules also improve interpretability (ex.: explicit contour prediction before EF calculation).
- Leveraging synthetic and augmented data helps improve interpretability without adding biases to the predictions.
- Using the novel metric allows for good assesment of contradictions, goes further than text similarity.
- This method could be enhanced by the use of much more extensive datasets.
References
-
Ouyang, D., He, B., Ghorbani, A., Lungren, M.P., Ashley, E.A., Liang, D.H., & Zou, J.Y. (2019). EchoNet-Dynamic: a Large New Cardiac Motion Video Data Resource for Medical Machine Learning. ↩