Reconciling modern machine learning practice and the bias-variance trade-off
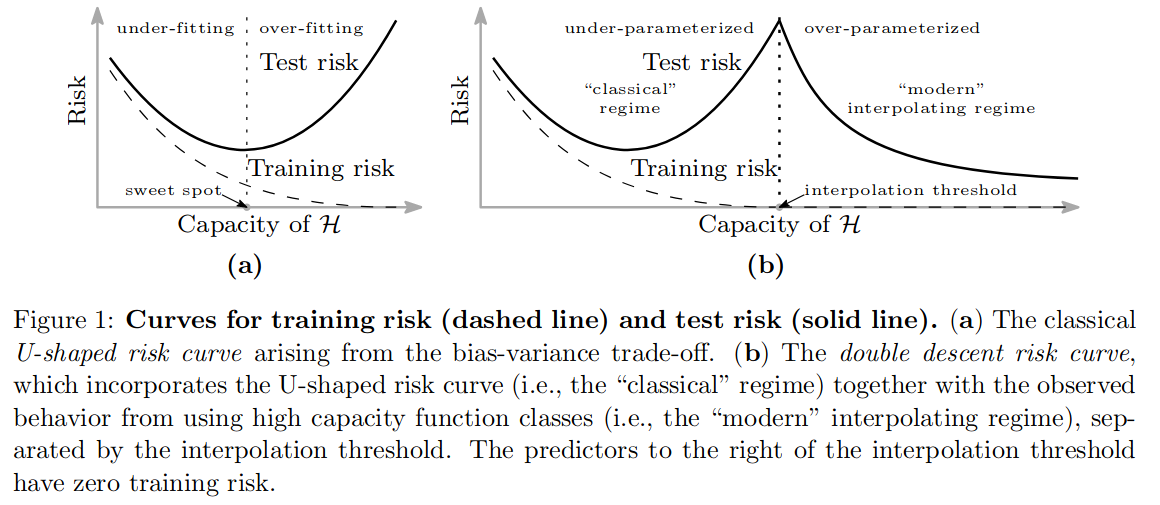
Common machine learning wisdom informs that the curve of the test risk (think “test loss at convergence”) as a function of the capacity of a model should follow a U-shape (going from underfitting to overfitting). However, in modern practice, using a very large capacity can yield a lower test risk. The authors propose an explanation for this observation.
In summary, test risk does follow a U-shaped curve before the capacity hits the interpolation threshold; however, after this threshold, risk decreases, eventually lower than before. At this point, a capacity increase, combined with a weight norm regularizer such as L2, makes the model smoother, while it still perfectly interpolates training data.
Important caveat: the authors did not study deep neural networks.
Experiments
To support these claims, the authors train to convergence different types of models:
- Neural networks with random Fourier features (1 learnable layer)
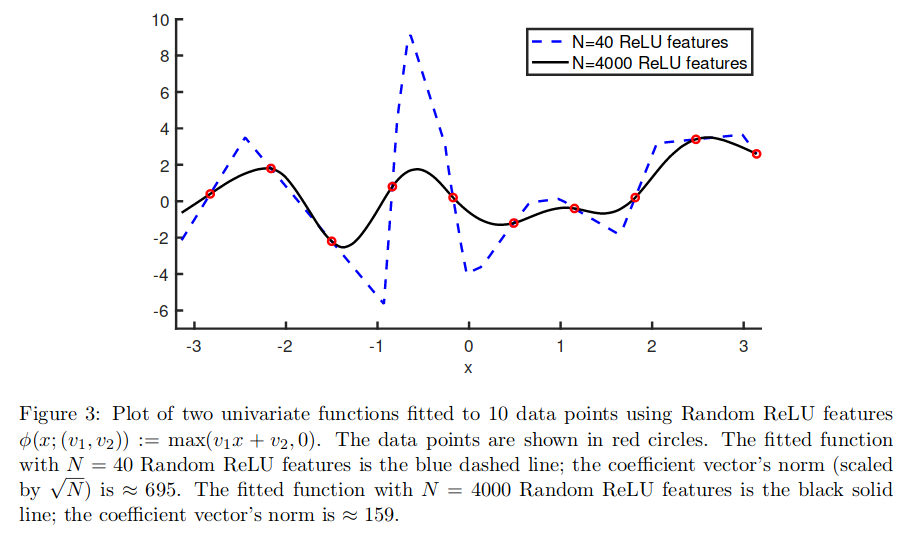
- Neural networks with random ReLU features (1 learnable layer)
- Decision trees
- Ensemble methods
- Fully connected neural network with a single hidden layer (2 learnable layers)
The last one, for which results are in the appendix, is the closest to typical models used in deep-learning. For each model, they recreate the double descent curve with a plot of the test loss as a function of model capacity.
Here are the curves for the random Fourier features model and the fully connected network:
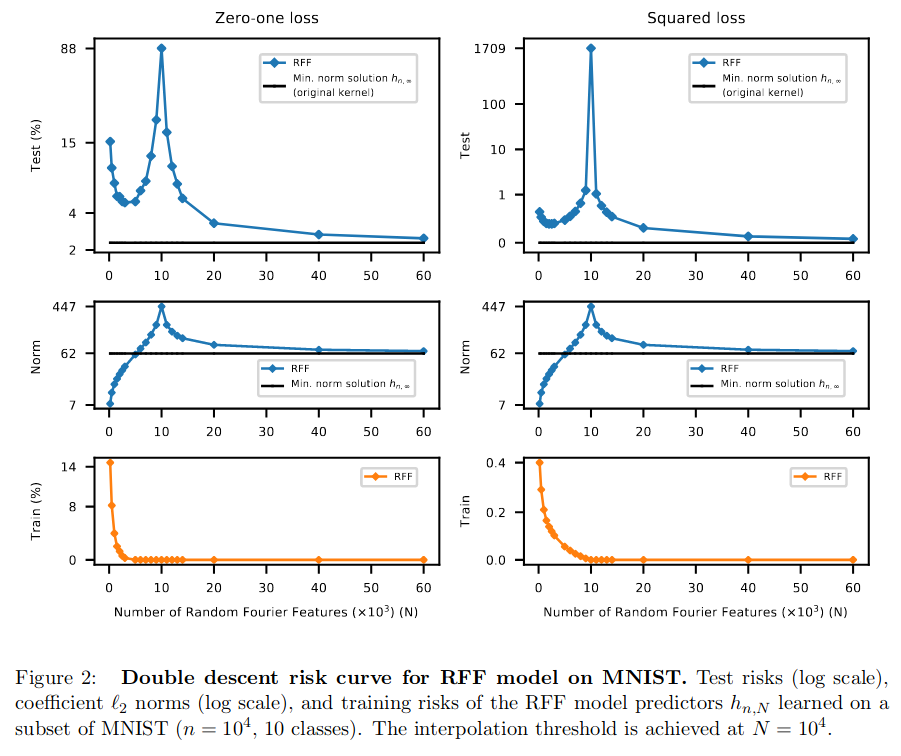
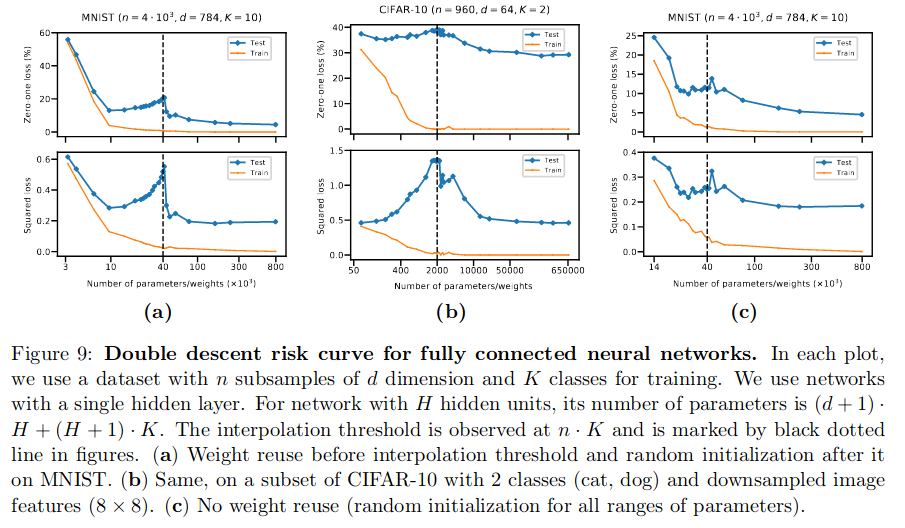
In those curves, the peak corresponds to the interpolation threshold. For a regression task, this threshold is where the number of parameters \(N\) equals the number of data points \(n\). For a classification task with \(C\) classes, the threshold is expected at \(N = C \cdot n\).
Below is an illustration of a univariate regression task. While the 40-feature model in blue interpolates the data perfectly, the 4000-feature model also does it, but with a smoother model (and lower norm).
Conclusions
- It is not clear how these results transfer to deep learning. It would be interesting to try to produce these curves for deep models.
- Small datasets, like medical datasets: the double descent curve might make sense.
- Heavy datasets, like ImageNet: \(N = C \cdot n = 10^3 \cdot 10^6 = 10^9\), which is larger than the size of most ImageNet models. For these models, the interpolation threshold seems very high compared to successful model sizes. Maybe there is some power in deep-learning to decrease this threshold? Maybe these models are in the classical regime?