Deep Active Learning for Axon-Myelin Segmentation on Histology Data
Highlights
Authors present a framework for Deep Active Learning to segment myelin on histology data. Their model relies on the U-Net architecture and an overall uncertainty measure to suggest which sample to annotate.
Introduction
Obtaining ground truth is an extremely tedious task and reducing the manual annotation effort by experts is an active research area in deep learning.
Active learning is a method that helps in that task by proposing “the most informative samples” so that the are annotated judiciously to help training the model.
The challenge in active learning resides in the definition of the acquisition function, i.e. the criteria on which new samples will be selected/estimating the uncertainty of the network prediction.
Methods
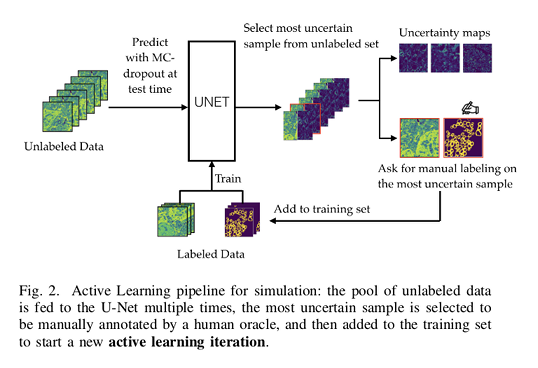
An initial small labeled dataset is used to train the neural network. A pool of unlabeled images is fed into the trained U-Net and a measure of uncertainty is computed for each unlabeled sample.
They are subsequently ranked based on this uncertainty measure. The most uncertain samples arre then selected to be annotated by an oracle (i.e. a human expert) and added to the training set. The U-Net is then re-trained from scratch with this updated set of images.
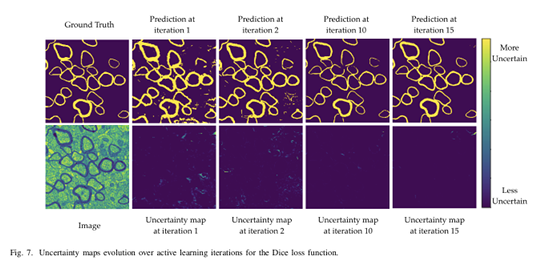
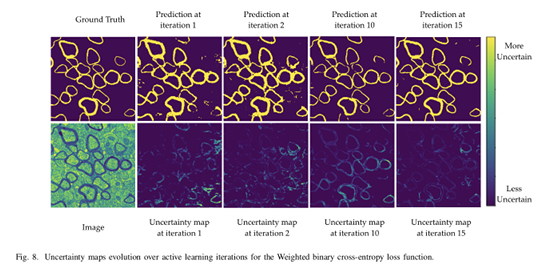
This framework also allows to output additional information: uncertainty maps for each unlabeled samples.
The uncertainty measure used by the authors is based on taking Monte Carlo samples while using a dropout regularization scheme. This approach is called Monte-Carlo Dropout (MC-Dropout).
To perform MC-Dropout and generate stochastic MC samples while regularizing the model, dropout layers are introduced after every MaxPooling layers.
By keeping active the dropout at prediction time and by performing multiple forward passes the approximate posterior can be sampled. The multiple predictions will be slightly different as different neurons will be activated or deactivated thanks to the dropout stochasticity.
The uncertainty is then defined as the posterior probabilities’ standard deviation of the predictions. The overall uncertainty is then computed by summing uncertainty maps’ pixels values.
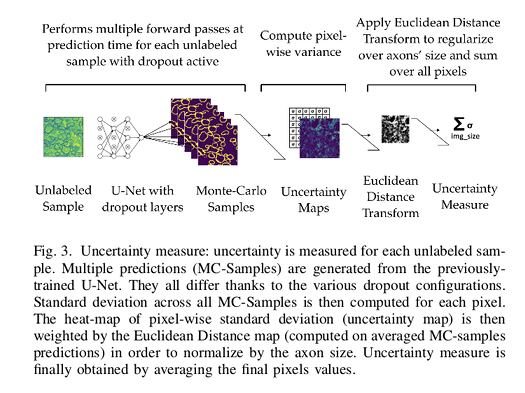
As expected, the model seems more uncertain near class borders. To overcome this issue, authors propose to multiply the uncertainty map image with the Euclidean distance transformation of the prediction (0.5 threshold applied to prediction probabilities).
Data
Two realistic small datasets of 14 and 24 microscopic histology images of spinal cord and brain samples to perform myelin segmentation task were used:
-
Serial Block-Face Electron Microscopy (SBFM): the initial training set contained 5 patches; the validation set and test set contained 10 patches each. The pool of unlabeled samples contained the 26 leftover patches.
-
Transmitting Electron Microscopy (TEM) dataset: the initial training set contained only 2 patches; the validation set consisted of 2 patches and the test set of 20 patches. 72 patches remained for the unlabeled pool of data.
The validation and test sets remain the same for each case.
Authors used typical data augmentation methods, including random shifting, rotation, flipping, and zooming to limit overfitting and to improve generalization.
The Dice loss and weighted binary cross-entropy were successively used to train the U-Net.
The Dice coefficient computed between the prediction and the ground truth mask on the test set as the evaluation metric.
Results
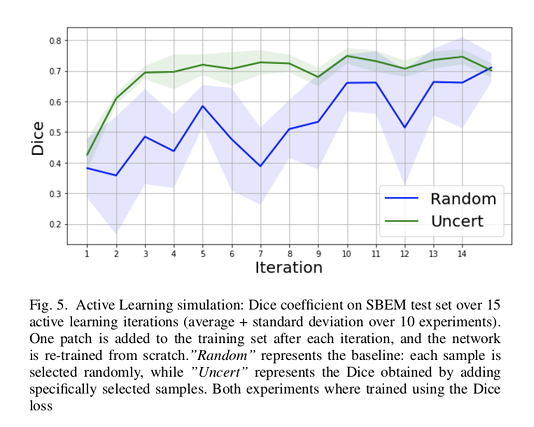
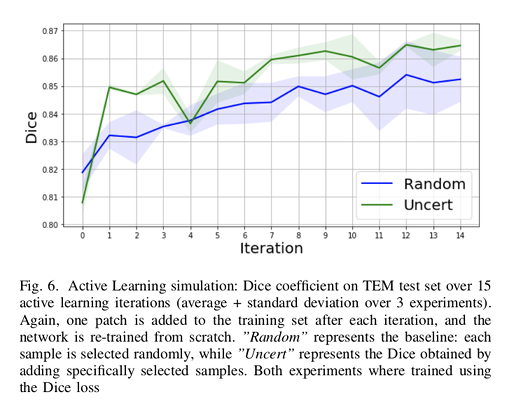
Authors used random selection as the baseline method.
The results show that their method reaches a maximum Dice value after adding only 3 uncertainty-selected samples to the initial training set, versus 15 randomly-selected samples.
Additionally, the gap between the two Dice curves is progressively decreasing.
Conclusions
The approach presented by the authors has proven to be efficient for reducing manual labeling time when training new models: only a reduced number of image patches can be sufficient to train efficiently a model.
Their uncertainty-based selection criteria seems to select the most informative samples for the model to learn from.
Also, the visualization of uncertainty by displaying the corresponding heatmaps is useful for the users to apprehend where their model would tend to fail the most.
The authors mention a few limitations or aspects to work on in the future based on their approach:
- They retrained the networks from scratch after adding new data. A more efficient solution would make use of pre-trained models to initialize the network.
- The use of the Dice coefficient as the sole metric is a possible source of bias. Other metrics could be incorporated (specificity, sensitivity, etc.).
- Exploring new acquisition functions and uncertainty/risk evaluations.