Co-trained convolutional neural networks for automated detection of prostate cancer in multi-parametric MRI
Summary
This paper presents an automated Prostate cancer (mentionned as PCa) detection system which can concurrently identify the presence of PCa in an image and localize lesions based on co-trained convolutional neural network (CNN) features and a single-stage SVM classifier. Each network is trained using images of a single modality (ADC or T2w) in a weakly-supervised manner (labels only indicate the presence of PCa without lesions’ locations).
Method
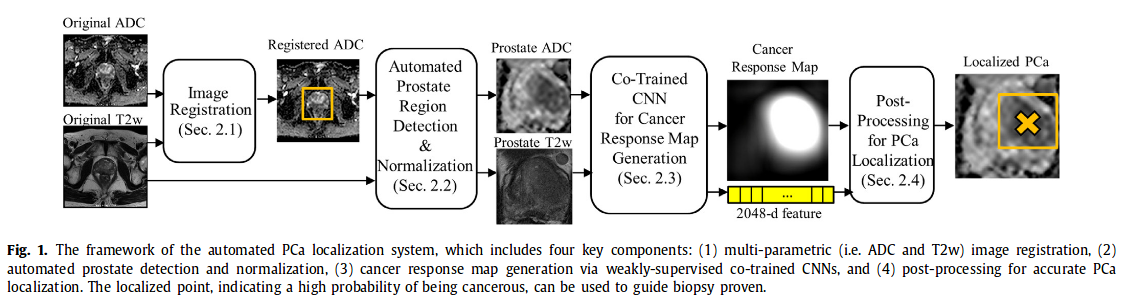
1. Image registration ADC and T2w images are aligned (ADC on the reference T2w). Method Free Form Model based on mutual information maximization
2. Automatic detection of prostate region The detection is done with a simple regression CNN network. Image is then cropped and intensities normalized
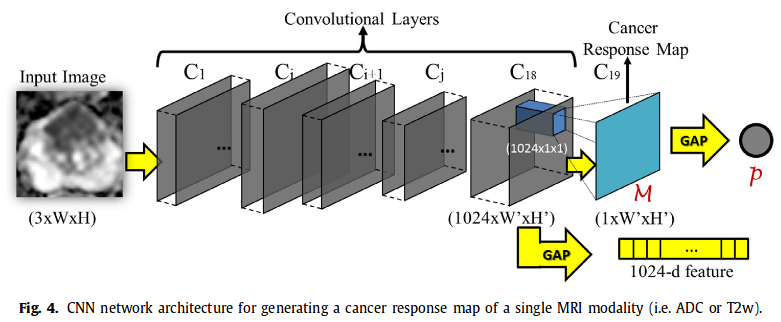
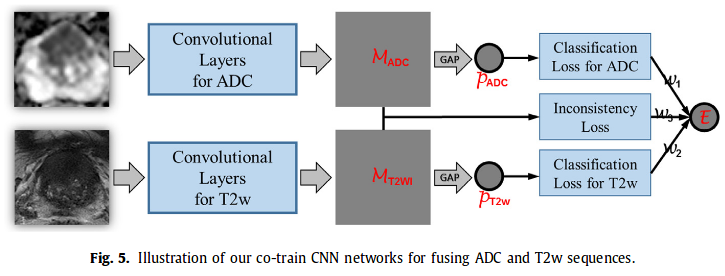
3. Co-Trained CNN for Cancer Response Map generation Each pair of aligned ADC and T2w is input in the CNN (architecture similar to GoogleNet)-> output cancer response map and a 1024 feature vector (1024 ADC + 1024 T2w are then concatenated). Cancer response map then converted into a scalar p = projected gap score = likelihood wether a 2D MRI slice contains PCa or not.
4. Post processing for PCa localization
Concatenated 2048 feature vector of each slice is input into a RBF-SVM classifier (better results than softmax). Ouput probability of containing PCa -> perform processing on ADC CRMs of the selected slices.
Non-maximum suppression on M_ADC to detect local maximum points as the candidates. Candidates with response values above a threshold (based on Otsu’s algorithm) are kept.
Loss
They define a error E which is a weighted sum of 3 losses :

l(p,y) are cross entropy losses and l(M_ADC, M_T2w) is defined as :
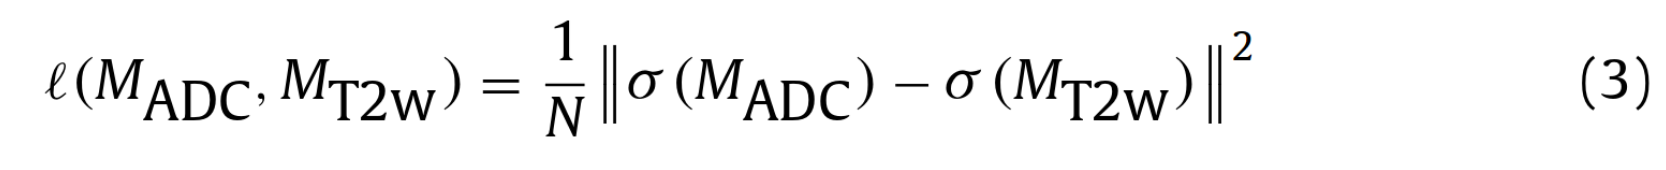
They chose w1 = w2 = 1 and w3 = 0.2 (selected empirically).
Contributions
1st work of PCa detection which performs multimodal fusion by co-training CNN features for both modalities, where the information of each modality is employed to guide the CNN feature learning of the other modality.
Experiments
- 160 patients : 72 Pca and 88 BPH (PCa free)
- images acquired on a 3T MRI
- data augmentation : non-rigid deformation
- reference : 2 experts manually outlined the region of interest for each positive patient on 5 T2w slices -> intersection of the 2 delineations
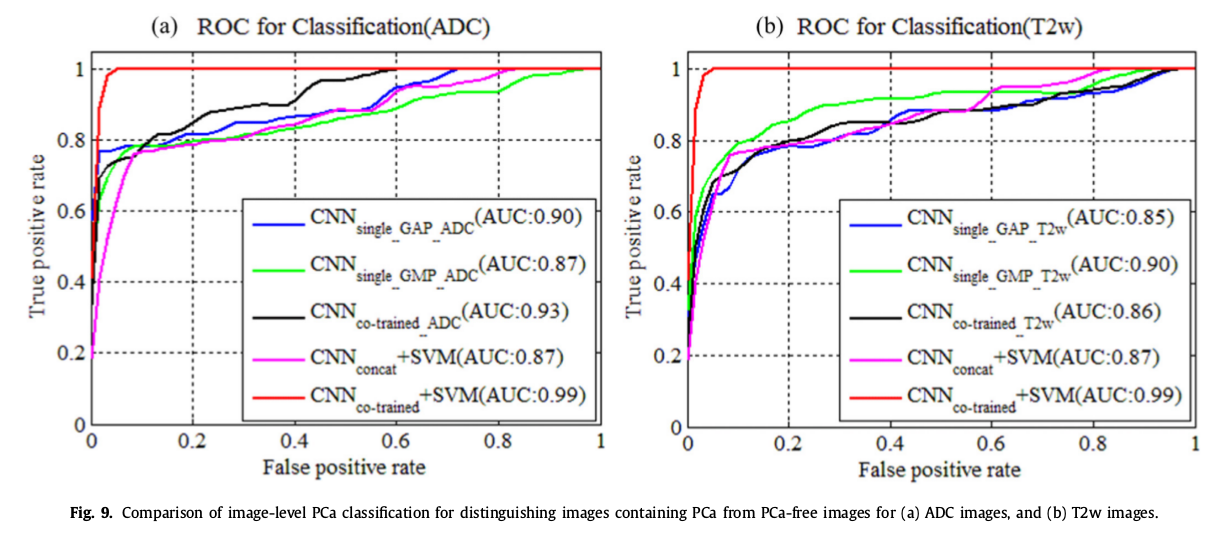
- evaluation metrics : FROC curve for overall performance, ROC for binary task PCa vs lesion-free images, LLF and NL for localization performance
Pre-trained CNN vs training from scratch
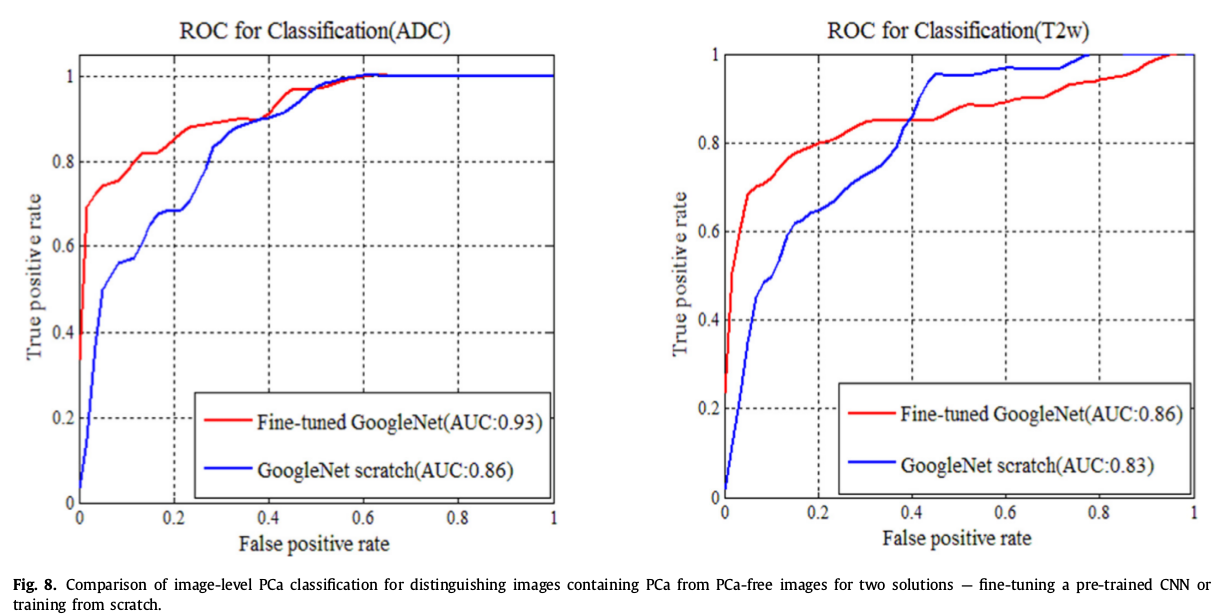
6 variants of the method to distinguish PCa vs lesion-free images
PCa localization
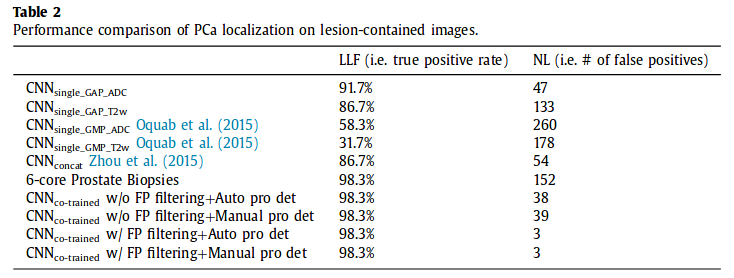
LLF = Lesion Localization Fraction : total nb of detected point within a real lesion / total nb of true lesions (true positive)
NL = Non-Lesion Localization (false positive)
Dice DSC = 0.66, which is not the best but they argue that their method requires less manual annotation effort.
Overall performance
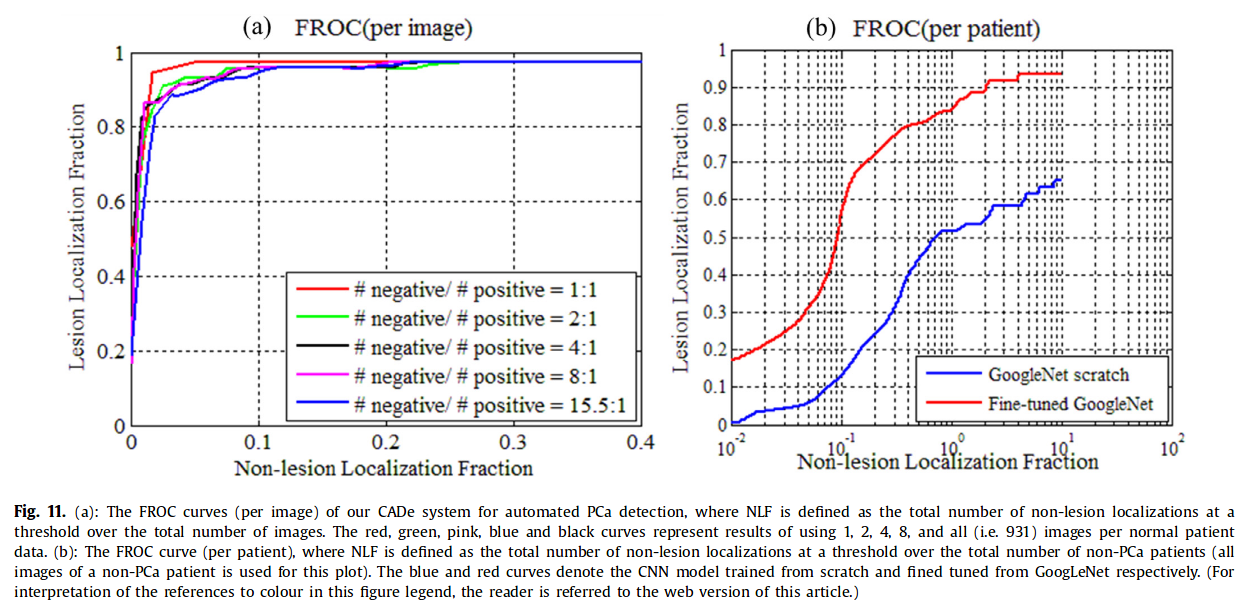
AUC 0.97, 0.96, 0.96, 0.96, 0.95 for 1, 2, 4, 8 and all images per normal patient data.
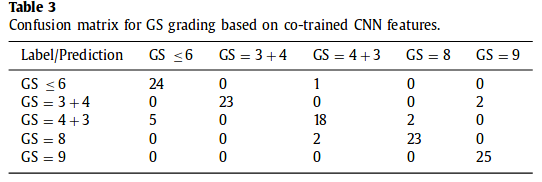
Confusion matrix for GS grading
Preliminary evaluation based on 25 training samples. 5 lesions per category for training and 5 lesions for testing. 5 slices 2D per lesions.
Conclusion
- Feasible to learn lesion localization with weakly-supervised CNN
- Benefit of incorporating information of one modality into the feature learning process of the other