The Building Blocks of Interpretability
This paper presents ways to visualize what a CNN detects and explain how it develops its understanding, while keeping the amount of information human-scale. For example, authors show how a network looking at a labrador retriever detects floppy ears and how that influences its classification.
To understand this paper, you might want to read this paper first : feature-visualization
Visualization 2.0
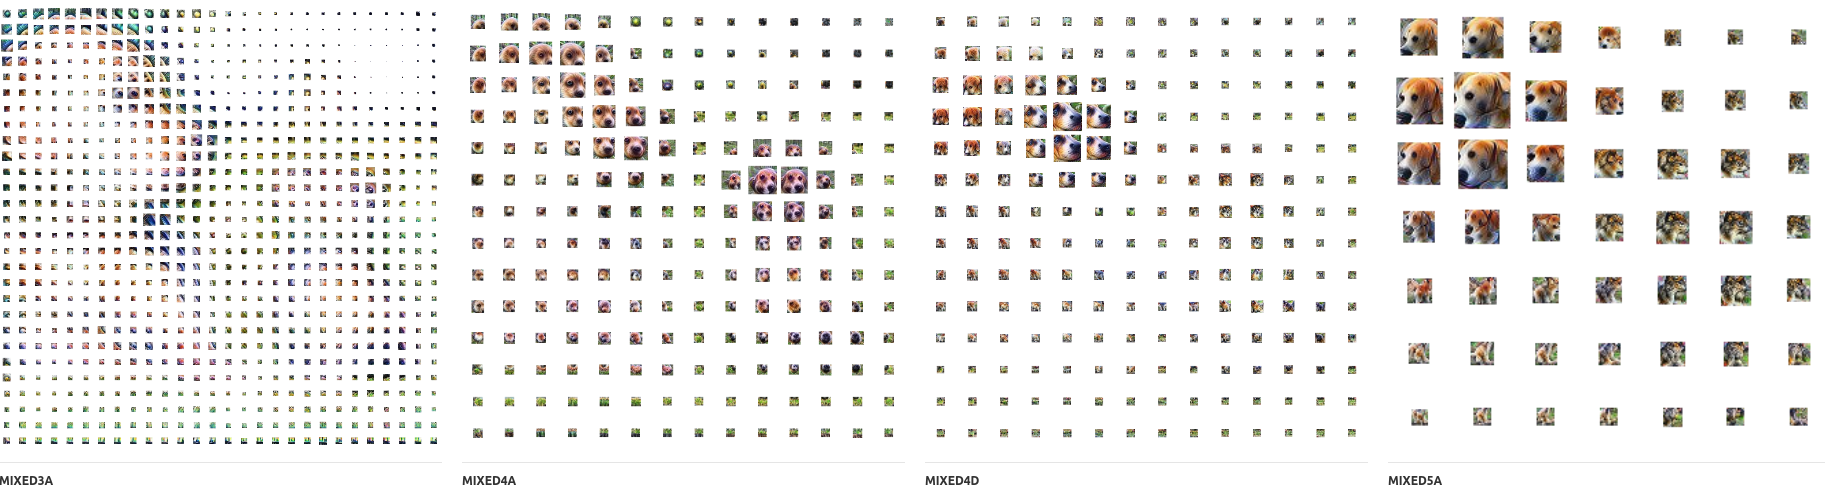
Using GoogLeNet. They show that instead of visualizing individual neurons, we can instead visualize the combination of neurons that fire at a given spatial location.
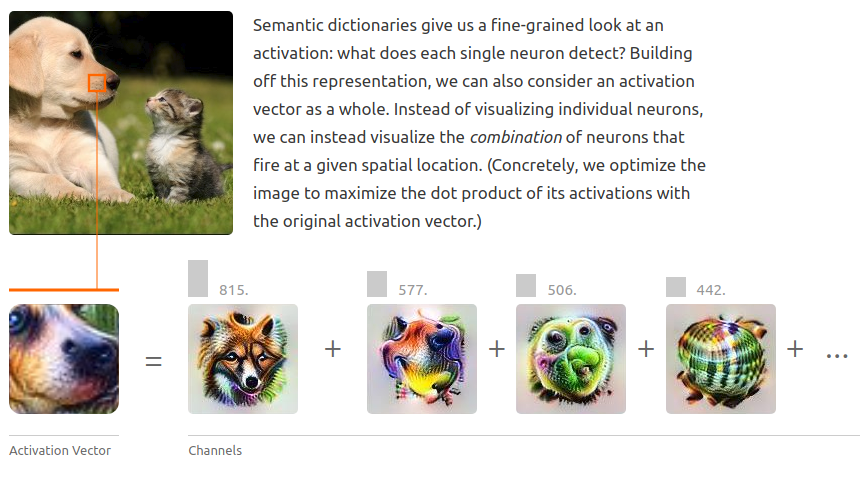
Applying this technique to all the activation vectors allows us to not only see what the network detects at each position, but also what the network understands of the input image as a whole
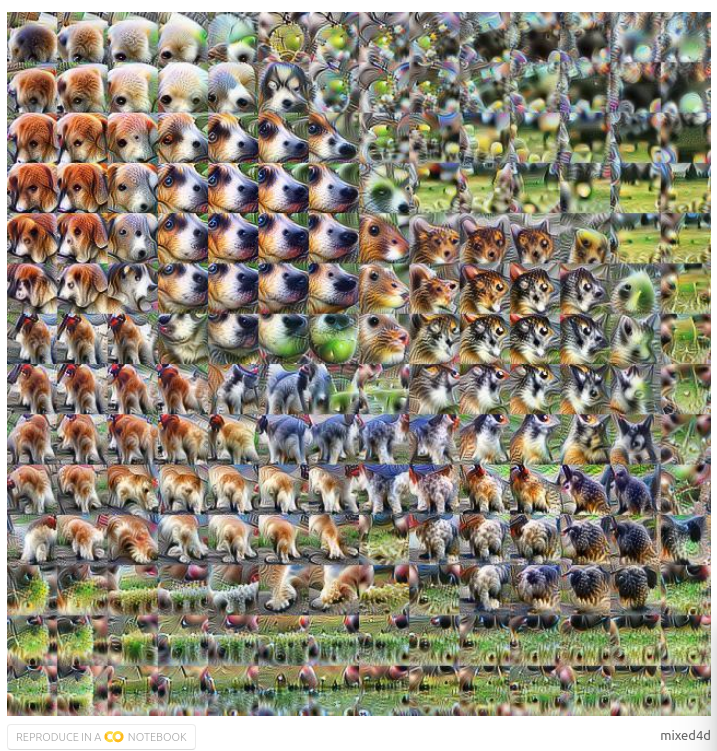
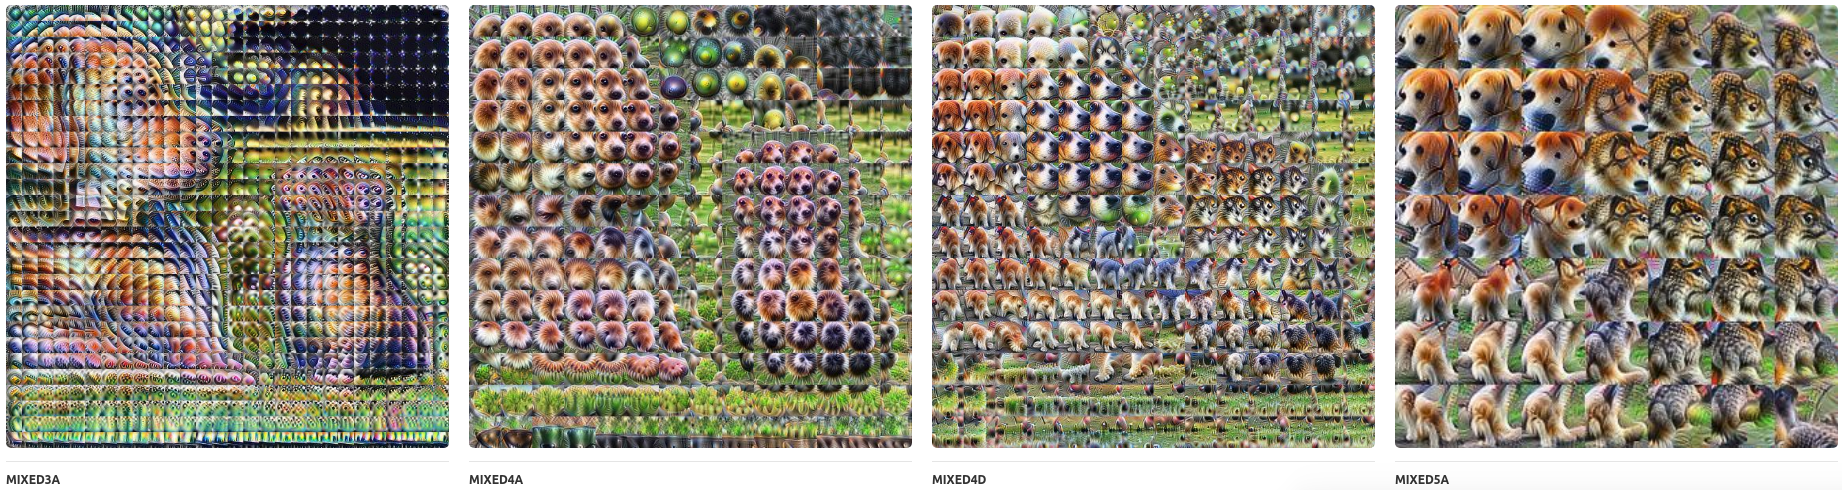
different layers
with the magnitude of the activation
How are concepts assembled?
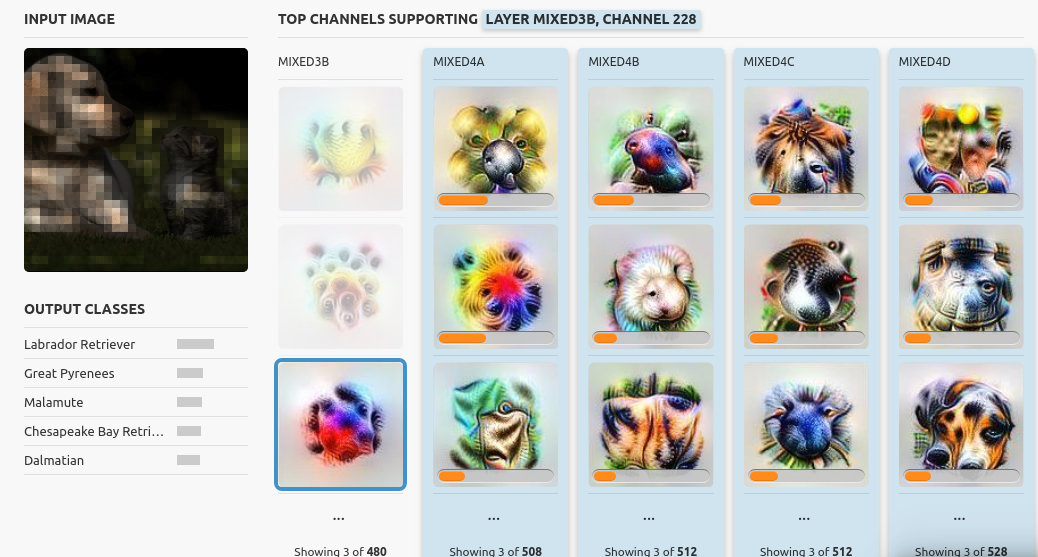
Authors also give an alternate way to visualize saliency maps by considering channels instead of spatial locations. Doing so allows to perform channel attribution: how much did each detector contribute to the final output?